The markets had a wide-ranging week once again; however, they ended near its high point this time. The Nifty had ranged sessions for four out of five days; the last trading day of the week saw the Nifty swinging wildly before closing near its high point. The trading range also remained wider; the Index oscillated 611 points over the past sessions. The volatility, though, took a back seat. The India VIX came off by 7.69% to 13.05 on a weekly basis. The Nifty closed a notch above its immediate resistance points; the headline index finished the week with a net weekly gain of 90.50 points (+0.37%).

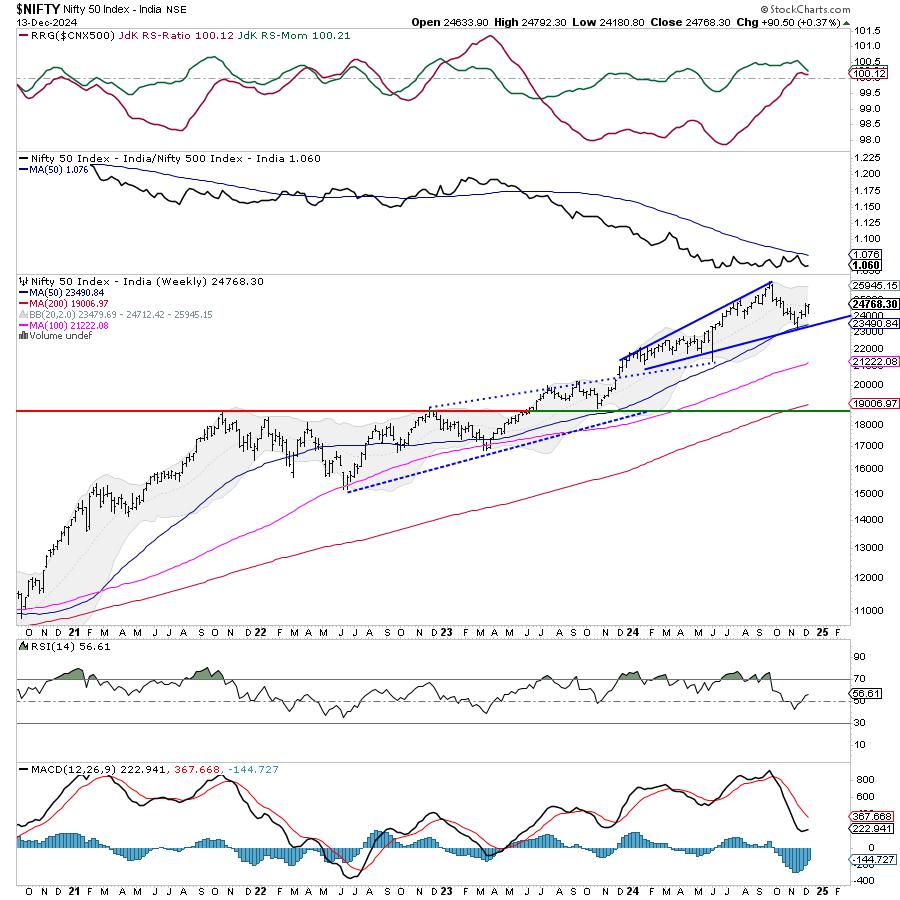
The week was set to end on a negative note had the markets not surged higher on Friday. From a technical perspective, Nifty has resisted the 100-DMA placed at 24709 over the past several days. Following a massive rebound that the Nifty witnessed from lower levels, the Index has closed a notch above this important resistance level. For this upmove to extend itself, Nifty will have to stay above the 24700 level. Any slippage below this point will again send the Nifty back inside the wide 24400-24700 trading range. Failure to sustain above the 24700 mark will mean an extended period of consolidation for the markets. However, the longer the Nifty stays above 24700, the greater the possibility of this upmove extending itself.
The coming week is expected to start quietly, with the levels of 24790 and 25000 acting as resistance points. The supports come in at 24590 and 24400 levels. The trading range will continue to stay wider than usual.
The weekly RSI is 56.37. It is neutral and does not show any divergence against the price. The weekly MACD is bearish and stays below its signal line.
The pattern analysis of the weekly charts shows that the Nifty suffered a brutal mean reversion process. The Index was 16% higher than its 50-week MA at one point in time. During the recent sharp corrective move, the Nifty tested this level again. It subsequently found support and staged a strong technical pullback. The market’s finding support at the 50-week MA has reinforced the credibility of this level as one of the important pattern supports for the market. On the daily timeframe, the Nifty has attempted to cross above the 100-DMA level after resisting it for a couple of days.
The markets may attempt to resume the technical pullback that it started by rebounding off the 50-week MA level. For this to happen, it would be crucial for Nifty to keep its head above the 24700 mark. It is also important to note that any slip below the 27400 level would drag the markets back inside the consolidation zone. The volatility is once again towards the lower end of its range; there is a possibility that we may see a surge in volatility in the coming week. It is recommended that investors stay invested in relatively stronger stocks and sectors. Rather than blindly chasing the rising stocks, investments must be appropriately rotated into the sectors showing stronger or improving relative strength. While mindfully protecting profits at higher levels, a cautious outlook is advised for the coming week.
Sector Analysis for the coming week
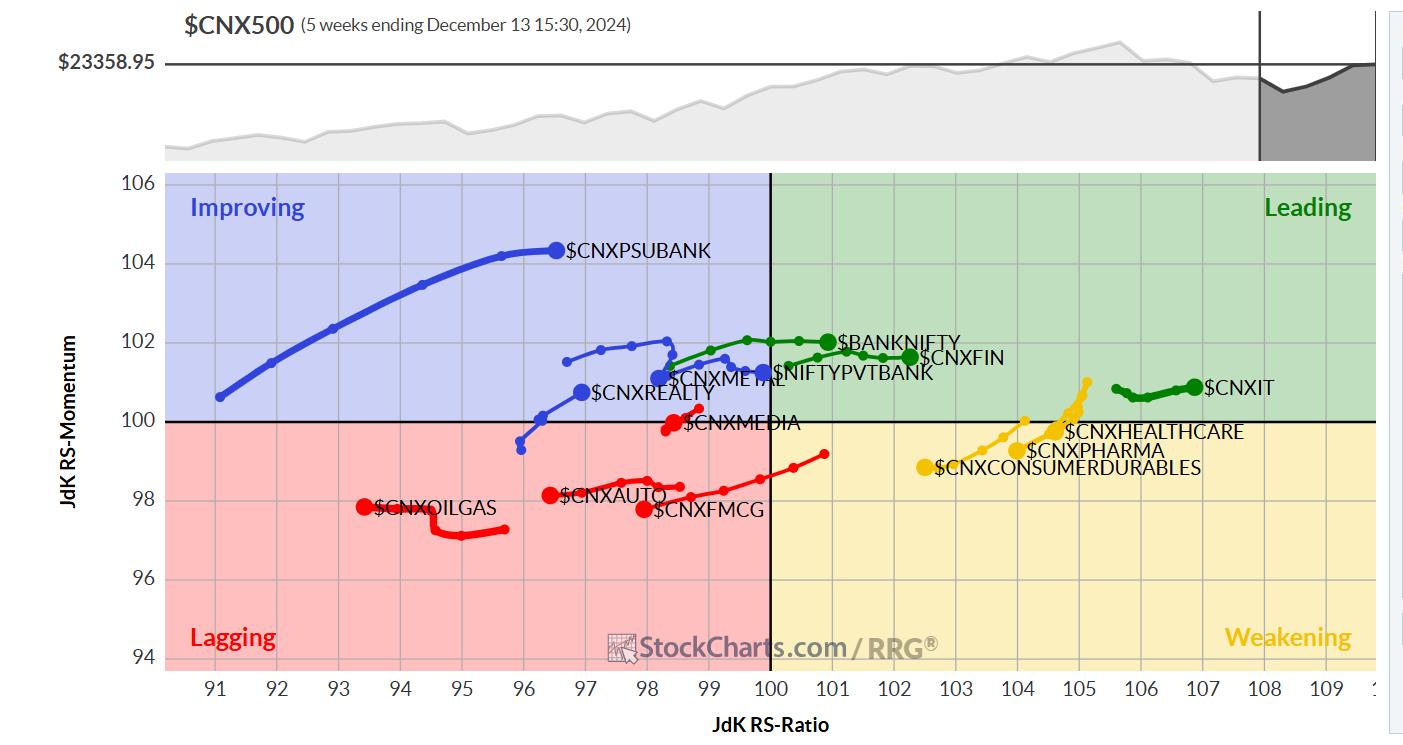
In our look at Relative Rotation Graphs®, we compared various sectors against CNX500 (NIFTY 500 Index), which represents over 95% of the free float market cap of all the stocks listed.

Relative Rotation Graphs (RRG) show no major change in the sectoral setup. The Nifty Bank, Financial Services, Private Banks, and IT indices are inside the leading quadrant. These groups are likely to outperform the broader markets relatively.
The Pharma and Midcap 100 indices are inside the weakening quadrant. These sectors are likely to see a continued slowdown in their relative performance.
The FMCG, Energy, Media, Auto, Energy, and Infrastructure indices are inside the leading quadrant. These groups may exhibit relative underperformance against the broader Nifty 500 index.
The PSU Bank index continues to rotate firmly inside the improving quadrant. The Realty and Metal indices are also inside the improving quadrant, and these groups are likely to improve their relative performance against the broader markets.
Important Note: RRG™ charts show the relative strength and momentum of a group of stocks. In the above Chart, they show relative performance against NIFTY500 Index (Broader Markets) and should not be used directly as buy or sell signals.
Milan Vaishnav, CMT, MSTA
Consulting Technical Analyst


